This example shows how to include pictures of a model, its sets and loads as well as some results.
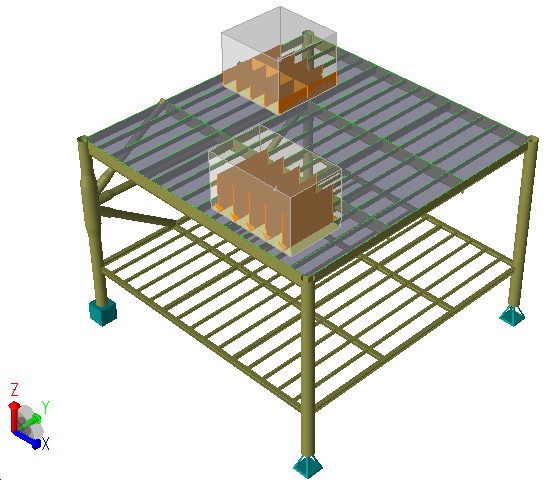
This script produces different plots for all sets and all load cases in a model and adds them to a report Extended_report.doc and Extended_report.htm.
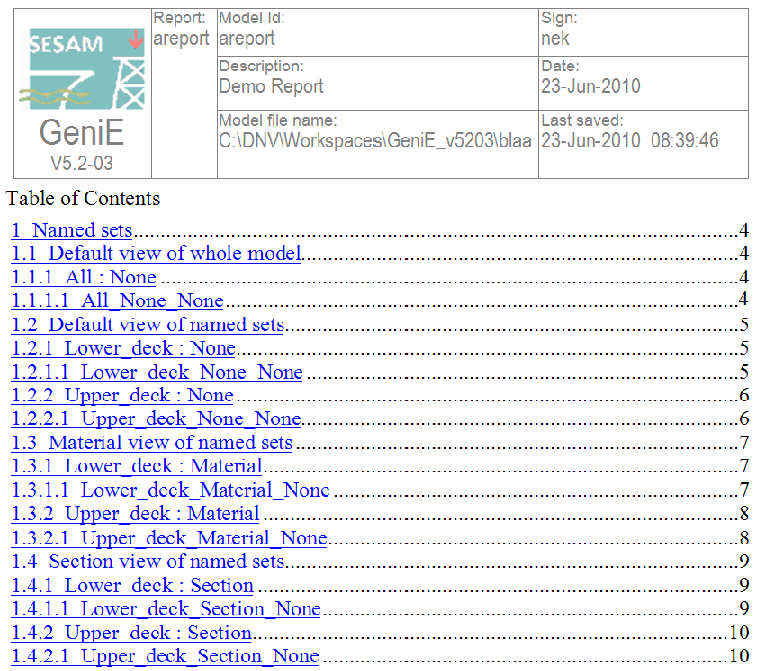
To generate the reports Extended_report.doc and Extended_report.htm you make a new workspace, read in the file Model_for_extended_reporting_in.js to make the model and loads (it will also run analysis) and finally read in the file Report_for extended_reporting.js.
The script may be edited to fit your own purposes.
The following functions are defined and used within the JS file:
box_beams - This functions finds and returns the bounding box of all the straight beams in the named set being passed into the function
view_vectors - This function determines the normal vector and local x-vector based on the geometry on the bounding box being passed into he function
plotConcepts - This function plots concepts with labelling and/or color coding (possibly with conceptual loads for a given loadcase)
plotMesh - This function plots FEM mesh with labelling and/or color coding (possibly with FEM loads for a given loadcase)
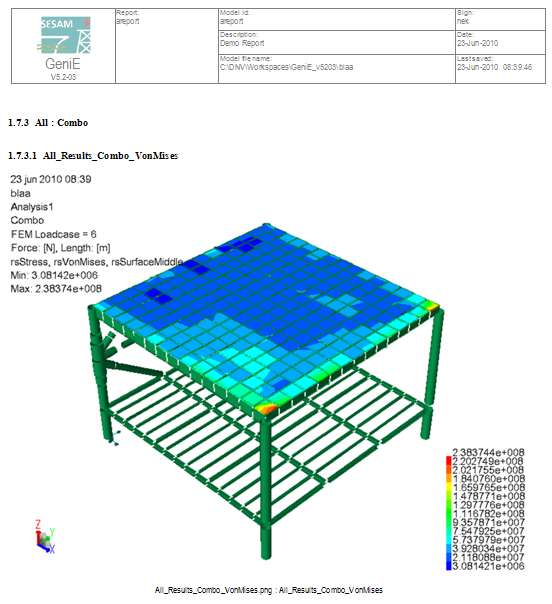
plotResult - This function plots FEM vonMises stress results for plate elements for a given loadcase
plotCapacity - This function plots capacity models with labelling and/or color coding (for a given loadcase or for worst loadcase)
The following should be noted:
The script may become inefficient for large models.
The bounding box and normal vector is being calculated based on the straight beams in a set. If a set contains no straight beams, the view will
default to isometric.
The vonMises Stress result plots only show stresses in plates.